Skeda:Helmholtz solution.png

Madhësia e këtij shikimi: 298 × 598 pixel. Rezolucione të tjera: 119 × 240 pixel | 239 × 480 pixel | 975 × 1.957 pixel.
Dokument origjinal ((përmasa 975 × 1.957 px, madhësia skedës: 23 KB, lloji MIME: image/png))
| Kjo skedë është prej Wikimedia Commons dhe mund të përdoret nga projekte të tjera. Përshkrimi në këtë skedë në këtë faqe nuk është treguar më poshtë. | Shko tek faqja përshkruese në Commons |
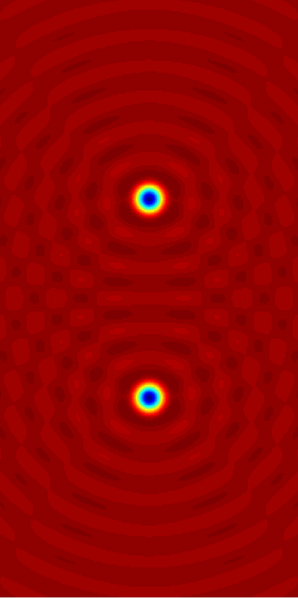
| Përshkrimi | Illustration of en:Helmholtz equation. |
| Data | (UTC) |
| Burimi | self-made with en:Matlab. See the source code below. |
| Autori | Oleg Alexandrov |
This diagram was created with MATLAB.
| Unë,krijuesi i kësaj pune, e lëshoj këtë punë në public domain. Kjo aplikohet në të gjithë botën. Në disa vende kjo mund të mos jetë e mundur ligjërisht; nëse është kështu: Unë i garantoj çdokujt të drejtën për ta përdorur këtë punë për çdo qëllim, pa asnjë kusht, përveç rasteve kur këto kushte janë të kërkuara nga ligji. |
Source code (MATLAB)
% Plot the solution to the Helmholtz equation with a given source
clear all;

Box_x = 3;
Scale = 0.5;
Box_y = Box_x/Scale;

Nx = 200;
Ny = Nx/Scale;

wavenumber = 10;

XX = linspace(-Box_x, Box_x, Nx);
YY = linspace(-Box_y, Box_y, Ny);
hx = XX(2) - XX(1);
hy = YY(2) - YY(1);
[X, Y] = meshgrid(XX, YY);

Source_size  = 0.5;
Source_shift = 2;
Source =  max(Source_size^2 - X.^2-(Y-Source_shift).^2, 0) + max(Source_size^2 - X.^2-(Y+Source_shift).^2, 0) ;

% plot the source
figure(1); clf; hold on; axis equal; axis off;
imagesc(Source);


% plot the solution to the Helmholtz equation
I = sqrt(-1);
Field = 0*X;

[m, n] = size(Source);
for i=1:m
   i
   for j=1:n

      if Source(i, j) ~= 0

	 x0 = X(i, j);
	 y0 = Y(i, j);

	 % add the contribution from the current source
	 Field = Field + (I/4)*besselh(0, 1, wavenumber*sqrt((X-x0).^2+(Y-y0).^2) + eps)*Source(i, j)*hx*hy;
      end

   end
end


figure(2); clf; hold on; axis equal; axis off;
imagesc(real(Field));

% Save to disk and convert to png right away
figure(1);
saveas(gcf, 'Helmholtz_source.eps', 'psc2');
%! convert -density 200 Helmholtz_source.eps Helmholtz_source.png

figure(2);
saveas(gcf, 'Helmholtz_solution.eps', 'psc2');
%! convert -density 200 Helmholtz_solution.eps Helmholtz_solution.png

|
Kjo math fotografi duhet duhen te behen edhe i here si nje SVG.
|
Historiku skedës
Shtypni mbi një datë/kohë për ta parë skedën siç ishte atëherë.
| Data/Koha | Miniaturë | Përmasat | Përdoruesi | Koment | |
|---|---|---|---|---|---|
| e tanishme | 7 korrik 2007 21:50 | | 975 × 1.957 (23 KB) | Oleg Alexandrov | Tweak |
| 7 korrik 2007 06:18 |  | 500 × 989 (22 KB) | Oleg Alexandrov | Higher res. | |
| 7 korrik 2007 05:59 |  | 500 × 989 (15 KB) | Oleg Alexandrov | {{Information |Description=Illustration of en:Helmholtz equation. |Source=self-made with en:Matlab. See the source code below. |Date=03:56, 7 July 2007 (UTC) |Author= Oleg Alexandrov }} {{PD-self}} ==MATLAB source code |
Lidhje skedash
Këto faqe lidhen tek kjo skedë:
Përdorimi global i skedës
Kjo skedë përdoret nga Wiki të tjera në vijim:
- Përdorimi në ar.wikipedia.org
- Përdorimi në ca.wikipedia.org
- Përdorimi në en.wikipedia.org
- Përdorimi në et.wikipedia.org
- Përdorimi në fa.wikipedia.org
- Përdorimi në fr.wikipedia.org
- Përdorimi në ko.wikipedia.org
- Përdorimi në no.wikipedia.org
- Përdorimi në pt.wikipedia.org
- Përdorimi në vi.wikipedia.org
- Përdorimi në www.wikidata.org
- Përdorimi në zh.wikipedia.org