Skeda:Vostok Petit data.svg

Dokument origjinal (skedë SVG, fillimisht 1.024 × 768 pixel, madhësia e skedës: 81 KB)
| Kjo skedë është prej Wikimedia Commons dhe mund të përdoret nga projekte të tjera. Përshkrimi në këtë skedë në këtë faqe nuk është treguar më poshtë. | Shko tek faqja përshkruese në Commons |
Përmbledhje
| Përshkrimi |
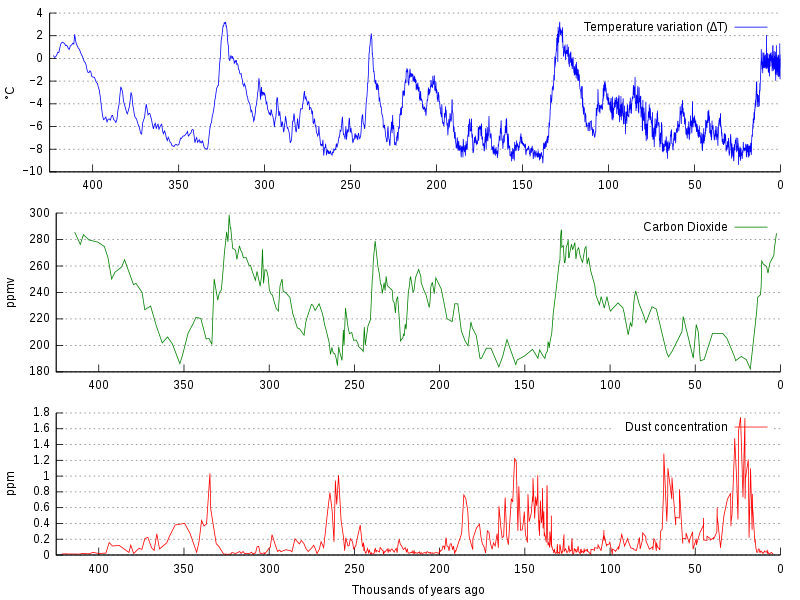
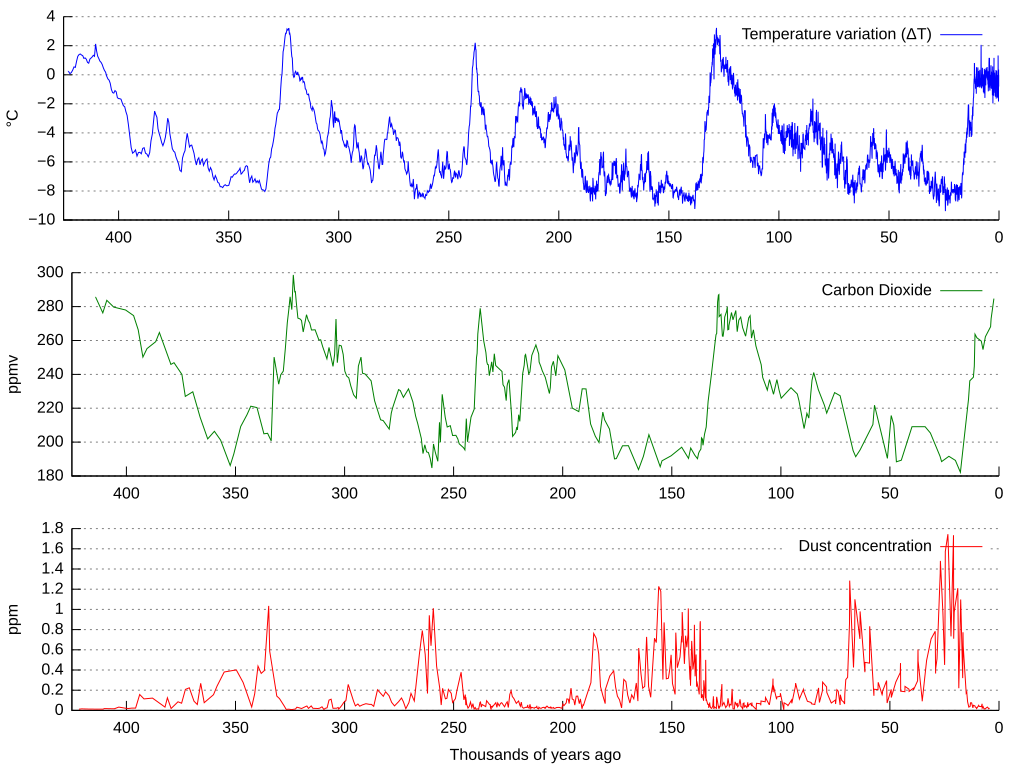
La bildo estas kopiita de wikipedia:en. La originala priskribo estas: Graph of CO2 (Green graph), temperature (Blue graph), and dust concentration (Red graph) measured from the Vostok, Antarctica ice core as reported by Petit et al., 1999. Higher dust levels are believed to be caused by cold, dry periods. The Earth's orbital eccentricity, tilt, and precession vary in a pattern over thousands of years. The IPCC notes that Milankovitch cycles drove the ice age cycles; CO2 followed temperature change "with a lag of some hundreds of years" (visible on a graph more zoomed in than this); and that as a feedback amplified temperature change. Among other factors, CO2 is more soluble in colder than in warmer waters. العربية: مخطّطٌ يُبيّن علاقة ثاني أوكسيد الكاربون ودرجة الحرارة وتركيز الغبار في قالب جليد فوستوك (بالإنجليزيّة: Vostok ice core) خلال 450,000 سنة الماضيّة |
| Data | |
| Burimi | Own work based on: Vostok-ice-core-petit.png by NOAA |
| Autori |
Original: I panjohur Vektor: |
| Versione tjera |
Derivative works of this file: |
| SVG genesis | This plot was created with Gnuplot. This file is translated using SVG switch elements: all translations are stored in the same file. |
Data sets used are:
- ftp://ftp.ncdc.noaa.gov/pub/data/paleo/icecore/antarctica/vostok/deutnat.txt
- ftp://ftp.ncdc.noaa.gov/pub/data/paleo/icecore/antarctica/vostok/co2nat.txt
- ftp://ftp.ncdc.noaa.gov/pub/data/paleo/icecore/antarctica/vostok/dustnat.txt
Kodi burimor
Gnuplot code
unset multiplot
set term svg size 1024,768
set output "vostok-data.svg"

set border 3
set xtics nomirror
set ytics nomirror
unset xlabel
unset ylabel

set grid y
set multiplot layout 3,1

set ylabel "°C"
plot [-425:0] [-10:4] \
        "deutnat.txt" \
        using (-$2/1000):4 \
        title "Temperature variation (ΔT)" \
        ls 3 \
        with lines

set ylabel "ppmv"
plot [-425:0] \
        "co2nat.txt" \
        using (-$1/1000):2 \
        title "Carbon Dioxide" \
        ls 2 \
        with lines

set xlabel "Thousands of years ago"
set ylabel "ppm"
plot [-425:0] \
        "dustnat.txt" \
        using (-$1/1000):2 \
        title "Dust concentration" \
        ls 1 \
        with lines
Explanation
After executing gnuplot, the resulting SVG file was manually changed to
* remove the negative signs for the x axis values
* change the [[:w:hyphen-minus|hyphen-minus]] characters in the temperature axis values to proper minus sign characters
| Kjo skedë licencohet sipas Creative Commons Attribution-Share Alike 3.0 Unported. | ||
| ||
| Kjo etiketë licencimi u shtua te kjo skedë si pjesë e përditësimit të lincecimit. GFDL. |

|
Ju jepet leje për ta kopjuar, shpërndarë dhe/ose ndryshuar këtë dokument sipas kushteve të Licencës GNU për Dokumentim të Lirë, versioni 1.2 ose çfarëdo versioni të mëpasshëm të botuar nga Free Software Foundation; pa Seksione të Pandryshueshme, pa Tekste Kapakësh të Përparmë, dhe pa Tekste Kapakësh të Pasmë. Një kopje e kësaj licence është përfshirë në seksionin e titulluar GNU Free Documentation License. |
Regjistri origjinal i ngarkimeve
This image is a derivative work of the following images:
- Vostok-ice-core-petit.png licensed with Cc-by-sa-3.0-migrated, GFDL
- 2006-02-15T20:38:10Z Maksim 598x441 (31557 Bytes) La bildo estas kopiita de wikipedia:en. La originala priskribo estas: Graph of [[carbon dioxide|CO2]], [[temperature]], and dust concentration measured from the [[Vostok, Antarctica]] [[ice core]] as reported by Petit et al.
Uploaded with derivativeFX
Historiku skedës
Shtypni mbi një datë/kohë për ta parë skedën siç ishte atëherë.
| Data/Koha | Miniaturë | Përmasat | Përdoruesi | Koment | |
|---|---|---|---|---|---|
| e tanishme | 25 qershor 2021 15:01 | | 1.024 × 768 (81 KB) | Matěj Orlický | File uploaded using svgtranslate tool (https://svgtranslate.toolforge.org/). Added translation for cs. |
| 1 dhjetor 2013 00:25 |  | 1.024 × 768 (77 KB) | SeL media | time axis reversed | |
| 25 shtator 2011 19:39 |  | 1.024 × 768 (309 KB) | Hel-hama | text improved | |
| 27 prill 2011 05:07 |  | 1.024 × 768 (83 KB) | Awickert | Didn't realize that it was a draw-on box instead of a measuring-box. Take 3! | |
| 27 prill 2011 05:05 |  | 1.024 × 768 (83 KB) | Awickert | [Shoot - last time, picked original instead of new version to upload] Manually moved axes in Inkscape such that the three plots line up with one another | |
| 27 prill 2011 05:02 |  | 1.024 × 768 (75 KB) | Awickert | Manually moved axes in Inkscape such that the three plots line up with one another | |
| 20 qershor 2010 15:25 |  | 1.024 × 768 (75 KB) | Autopilot | {{Information |Description=La bildo estas kopiita de wikipedia:en. La originala priskribo estas: Graph of CO<sub>2</sub> (Green graph), temperature (Blue graph), and dust concentration (Red graph) measured from the [[Vostok, Antarc |
Lidhje skedash
Këto faqe lidhen tek kjo skedë:
Përdorimi global i skedës
Kjo skedë përdoret nga Wiki të tjera në vijim:
- Përdorimi në af.wikipedia.org
- Përdorimi në ar.wikipedia.org
- Përdorimi në be.wikipedia.org
- Përdorimi në bg.wikipedia.org
- Përdorimi në ca.wikipedia.org
- Përdorimi në cs.wikipedia.org
- Përdorimi në cy.wikipedia.org
- Përdorimi në da.wikipedia.org
- Përdorimi në de.wikipedia.org
- Përdorimi në en.wikipedia.org
- Climate variability and change
- Global cooling
- Ice core
- Orbital forcing
- Quaternary glaciation
- Carbon dioxide in Earth's atmosphere
- Talk:Ice age/Archive 1
- File talk:Vostok Petit data.svg
- List of periods and events in climate history
- User talk:Jc-S0CO/Archives/2013/2
- User:Mark Buchanan/sandbox/QuatGlac
- User:Mark Buchanan/sandbox/Glaciation-WIP
- Portal:Climate change
- Talk:Climate variability and change/Archive 8
- Përdorimi në en.wikiversity.org
- Përdorimi në es.wikipedia.org
- Përdorimi në eu.wikipedia.org
- Përdorimi në fa.wikipedia.org
- Përdorimi në fi.wikipedia.org
- Përdorimi në fi.wikiversity.org
- Përdorimi në fr.wikipedia.org
- Përdorimi në gl.wikipedia.org
- Përdorimi në ha.wikipedia.org
- Përdorimi në he.wikipedia.org
- Përdorimi në it.wikipedia.org
- Përdorimi në ja.wikipedia.org
Shikoni më shumë përdorim global të kësaj skede.