Skeda:Bilininterp.png
Madhësia e këtij shikimi: 750 × 600 pixel. Rezolucione të tjera: 300 × 240 pixel | 601 × 480 pixel | 1.002 × 801 pixel.
Dokument origjinal ((përmasa 1.002 × 801 px, madhësia skedës: 27 KB, lloji MIME: image/png))
| Kjo skedë është prej Wikimedia Commons dhe mund të përdoret nga projekte të tjera. Përshkrimi në këtë skedë në këtë faqe nuk është treguar më poshtë. | Shko tek faqja përshkruese në Commons |
Përmbledhje
Own work.
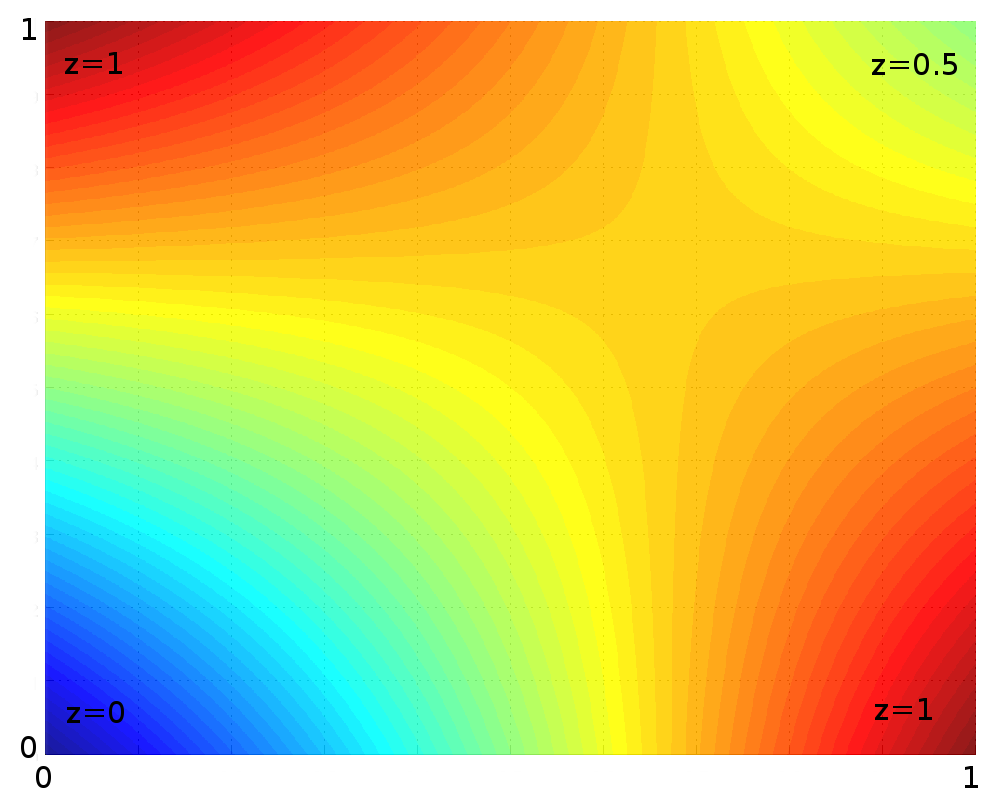
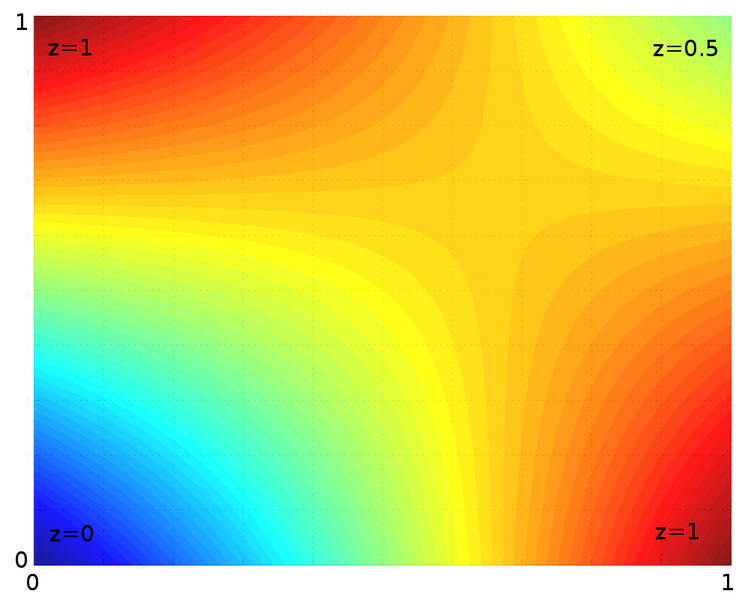
Illustrates bilinear interpolation on the unit square. The four corners have fixed values as indicated in the figure, and the values in between are interpolated, and the interpolated values are represented by the colour.
Done in Matlab, source code:
# Grid of known points:
>> [X, Y] = meshgrid(0:1)
# Grid for interpolated values:
>> [XI,YI] = meshgrid(0:0.001:1);
# Known values to interpolate from:
>> Z = [0 1; 1 0.5]
# Do bilinear interpolation
>> ZI = interp2(X,Y,Z,XI,YI);
# Visualize result:
>> surf(XI,YI,ZI, 'EdgeColor','none'); alpha(0.9)
>> view([0 90])
>> print -dpng Bilininterp.png
See also
Licencim
| Unë,krijuesi i kësaj pune, e lëshoj këtë punë në public domain. Kjo aplikohet në të gjithë botën. Në disa vende kjo mund të mos jetë e mundur ligjërisht; nëse është kështu: Unë i garantoj çdokujt të drejtën për ta përdorur këtë punë për çdo qëllim, pa asnjë kusht, përveç rasteve kur këto kushte janë të kërkuara nga ligji. |
Historiku skedës
Shtypni mbi një datë/kohë për ta parë skedën siç ishte atëherë.
| Data/Koha | Miniaturë | Përmasat | Përdoruesi | Koment | |
|---|---|---|---|---|---|
| e tanishme | 30 qershor 2023 11:12 | | 1.002 × 801 (27 KB) | Phreneticc | Reduced file weight with FileOptimizer in lossless compression mode. |
| 21 mars 2007 22:18 |  | 1.002 × 801 (37 KB) | Berland | Own work. Illustrates bilinear interpolation on the unit square. The four corners have fixed values as indicated in the figure, and the values in between are interpolated, and the interpolated values are represented by the colour. |
Lidhje skedash
S’ka faqe që përdorin këtë kartelë.
Përdorimi global i skedës
Kjo skedë përdoret nga Wiki të tjera në vijim:
- Përdorimi në ar.wikipedia.org
- Përdorimi në cs.wikipedia.org
- Përdorimi në en.wikipedia.org
- Përdorimi në es.wikipedia.org
- Përdorimi në fa.wikipedia.org
- Përdorimi në fi.wikipedia.org
- Përdorimi në fr.wikipedia.org
- Përdorimi në he.wikipedia.org
- Përdorimi në ja.wikipedia.org
- Përdorimi në pt.wikipedia.org
- Përdorimi në ru.wikipedia.org
- Përdorimi në tr.wikipedia.org
- Përdorimi në uk.wikipedia.org
- Përdorimi në zh.wikipedia.org