Skeda:Student t pdf.svg

Size of this PNG preview of this SVG file: 360 × 288 pixel. Rezolucione të tjera: 300 × 240 pixel | 600 × 480 pixel | 960 × 768 pixel | 1.280 × 1.024 pixel | 2.560 × 2.048 pixel.
Dokument origjinal (skedë SVG, fillimisht 360 × 288 pixel, madhësia e skedës: 39 KB)
| Kjo skedë është prej Wikimedia Commons dhe mund të përdoret nga projekte të tjera. Përshkrimi në këtë skedë në këtë faqe nuk është treguar më poshtë. | Shko tek faqja përshkruese në Commons |
Përmbledhje
| Përshkrimi |
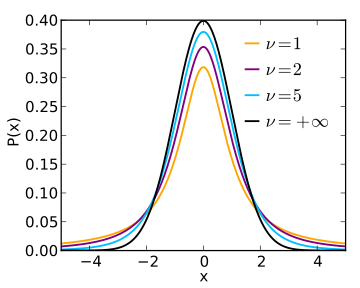
English: Plot of the density function for several members of the Student t family. |
| Data | |
| Burimi | Punë e juaja |
| Autori | Skbkekas |
| SVG genesis | This plot was created with Matplotlib. |
| Kodi burimor | Python code# Origin: Skbkekas
# Enhanced: Ika, 2013-07-24
import numpy as np
import matplotlib.pyplot as plt
import scipy.special as sp
col = ['orange', 'purple', 'deepskyblue']
X = np.arange(-5, 5, 0.001)
plt.clf()
plt.figure(figsize=(4,3.2))
plt.axes([0.17,0.13,0.79,0.8])
plt.hold(True)
A = []
for k,nu in enumerate([1,2,5]):
Y = -(nu+1)*np.log(1+X**2/nu)/2
Y += sp.gammaln((nu+1)/2.0)
Y -= sp.gammaln(nu/2.0)
Y -= 0.5*np.log(nu*np.pi)
a = plt.plot(X, np.exp(Y), '-', color=col[k], lw=1.5)
A.append(a[0])
# Draw the curve of Normal distribution, which is the limit of t-distribution sequence.
mu = 0 # mean = 0
sigma = 1 # variance = 1
M = 1/(sigma*np.sqrt(2*np.pi))
N = np.exp(-(X-mu)*(X-mu)/(2*sigma*sigma));
Y = M*N
a = plt.plot(X, Y, '-', color='black', lw=1.5)
A.append(a[0])
plt.xlabel("x")
plt.ylabel("P(x)")
bx = plt.legend(A, (r"$\nu=1$", r"$\nu=2$", r"$\nu=5$", r"$\nu=+\infty$"),\
numpoints=1, handlelen=0.05, handletextpad=0.4,\
loc="upper right")
bx.draw_frame(False)
plt.xlim(-5,5)
plt.savefig("student_t_pdf.pdf")
plt.savefig("student_t_pdf.svg")
|
Licencim
Unë, krijuesi i kësaj pune, e publikoj këtu në bazë të licensës në vijim:
Kjo skedë është dhënë për përdorim sipas licensës Creative Commons Attribution 3.0 Unported.
- Je i lirë të:
- ta shpërndani – ta kopjoni, rishpërndani dhe përcillni punën
- t’i bëni “remix” – të përshtatni punën
- Sipas kushteve të mëposhtme:
- atribuim – Duhet t’i jepni meritat e duhura, të siguroni një lidhje për tek licenca dhe të tregoni nëse janë bërë ndryshime. Këtë mund ta bëni në ndonjë mënyrë të arsyeshme, por jo në ndonjë mënyrë që sugjeron se licencuesi ju del zot juve apo përdorimit tuaj.
Historiku skedës
Shtypni mbi një datë/kohë për ta parë skedën siç ishte atëherë.
| Data/Koha | Miniaturë | Përmasat | Përdoruesi | Koment | |
|---|---|---|---|---|---|
| e tanishme | 21 korrik 2013 07:45 | | 360 × 288 (39 KB) | IkamusumeFan | 1. Using \nu instead of df; 2. The previous edition used 1000 to stand for infinity case. The limit of the t-distribution sequence is normal distribution. Thus, we use normal distribution instead. |
| 4 mars 2010 17:36 |  | 360 × 288 (30 KB) | Skbkekas | Last file was incorrectly uploaded as cdf. | |
| 4 mars 2010 17:35 |  | 360 × 288 (27 KB) | Skbkekas | Changed df's to give better spacing, used thinner lines. | |
| 23 shkurt 2010 06:08 |  | 360 × 288 (32 KB) | Skbkekas | {{Information |Description={{en|1=Plot of the density function for several members of the Student t family.}} |Source={{own}} |Author=Skbkekas |Date=2010-02-22 |Permission= |other_versions= }} [[Category:Statistical charts and diagrams] |
Lidhje skedash
Këto faqe lidhen tek kjo skedë:
Përdorimi global i skedës
Kjo skedë përdoret nga Wiki të tjera në vijim:
- Përdorimi në be.wikipedia.org
- Përdorimi në ca.wikipedia.org
- Përdorimi në cs.wikipedia.org
- Përdorimi në en.wikipedia.org
- Përdorimi në en.wikibooks.org
- Përdorimi në fi.wikipedia.org
- Përdorimi në it.wikipedia.org
- Përdorimi në ja.wikipedia.org
- Përdorimi në jv.wikipedia.org
- Përdorimi në ko.wikipedia.org
- Përdorimi në no.wikipedia.org
- Përdorimi në simple.wikipedia.org
- Përdorimi në sr.wikipedia.org
- Përdorimi në tl.wikipedia.org