Skeda:Indicator function illustration.png

Madhësia e këtij shikimi: 800 × 508 pixel. Rezolucione të tjera: 320 × 203 pixel | 640 × 406 pixel | 813 × 516 pixel.
Dokument origjinal ((përmasa 813 × 516 px, madhësia skedës: 19 KB, lloji MIME: image/png))
| Kjo skedë është prej Wikimedia Commons dhe mund të përdoret nga projekte të tjera. Përshkrimi në këtë skedë në këtë faqe nuk është treguar më poshtë. | Shko tek faqja përshkruese në Commons |
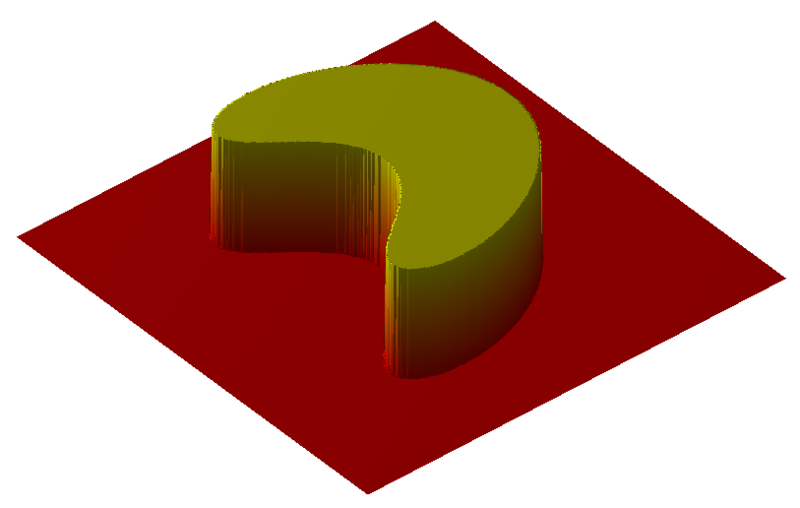
| Përshkrimi | Illustration of an en:Indicator function. |
| Data | (UTC) |
| Burimi | self-made with MATLAB, source code below |
| Autori | Oleg Alexandrov |
This diagram was created with MATLAB.
| Unë,krijuesi i kësaj pune, e lëshoj këtë punë në public domain. Kjo aplikohet në të gjithë botën. Në disa vende kjo mund të mos jetë e mundur ligjërisht; nëse është kështu: Unë i garantoj çdokujt të drejtën për ta përdorur këtë punë për çdo qëllim, pa asnjë kusht, përveç rasteve kur këto kushte janë të kërkuara nga ligji. |
Source code (MATLAB)
% illustration of an indicator function in two dimensions
function main()

   % the number of data points. More points means prettier picture.
   N = 400;

   % a function close to what we want, but not smooth
   Z = get_step_function (N);

% plot the surface
   figure(2); clf; hold on; axis equal; axis off;
   scale = 100;
   surf(scale*Z);

% make the surface beautiful
   shading interp;
   colormap autumn;

% add in a source of light
   camlight (-50, 54);

% viewing angle
   view(-40, 38);

   % save as png
   print('-dpng', '-r200', 'Indicator_function_illustration.png');


% get a function which is 1 on a set, and 0 outside of it
function Z = get_step_function(N)
   XX = linspace(-1.5, 4, N);
   YY = linspace(-4, 4, N);
   [X, Y] = meshgrid(XX, YY);

   c = 2;
   k=1.2;
   shift=10;
   Z = (c^2-X.^2-Y.^2).^2 + k*(c-X).^3-shift;

   Z =1-max(sign(Z), 0);

|
Kjo math fotografi duhet duhen te behen edhe i here si nje SVG.
|
Historiku skedës
Shtypni mbi një datë/kohë për ta parë skedën siç ishte atëherë.
| Data/Koha | Miniaturë | Përmasat | Përdoruesi | Koment | |
|---|---|---|---|---|---|
| e tanishme | 27 shtator 2007 03:49 | | 813 × 516 (19 KB) | Oleg Alexandrov | {{Information |Description=Illustration of an en:Indicator function. |Source=self-made with MATLAB, source code below |Date=~~~~~ |Author= Oleg Alexandrov }} <pre><nowiki> % illustration of an indicator function in two dime |
Lidhje skedash
Këto faqe lidhen tek kjo skedë:
Përdorimi global i skedës
Kjo skedë përdoret nga Wiki të tjera në vijim:
- Përdorimi në de.wikipedia.org
- Përdorimi në en.wikipedia.org
- Përdorimi në en.wikibooks.org
- Përdorimi në es.wikipedia.org
- Përdorimi në fi.wikipedia.org
- Përdorimi në fr.wikipedia.org
- Përdorimi në hi.wikipedia.org
- Përdorimi në id.wikipedia.org
- Përdorimi në it.wikipedia.org
- Përdorimi në ko.wikipedia.org
- Përdorimi në ms.wikipedia.org
- Përdorimi në nl.wikipedia.org
- Përdorimi në sr.wikipedia.org
- Përdorimi në sv.wikipedia.org
- Përdorimi në ta.wikipedia.org
- Përdorimi në uk.wikipedia.org
- Përdorimi në vi.wikipedia.org